Consultation at Pricewaterhouse Coopers
While my work at Pricewaterhouse Coopers was accomplished under a strict non-disclosure agreement, there are common themes to the methodologies and systems of my own personal brand that I brought to each engagement.
Qualitative research (interviews, usability testing) and data synthesis
Interface/product design
Workshop planning and facilitation
Design operations and strategy
Strategy recommendations in client deliverables
Mentorship for newer Associates
Co-authoring SOWs valuing millions of dollars for Fortune 500 clients
A Data Synthesis Methodology
One of my proudest moments at PwC was working with a team of Analysts, Designers, and Engineers to create grant management software for Principal Investigators (PIs) at one of the world’s leading medical research institutions.
Our team conducted interviews to understand journeys and pain points, which fed into a Design Sprint and determined the grant management focus. We developed prototypes in Figma and conducted two rounds of Usability Tests with iterations. Between the interviews and usability tests, we gathered thousands of data points.
We took our data synthesis seriously because the PIs we were trying to help are working towards life-saving initiatives every day and every second of their time counts. We wanted to ensure we got the most out of the qualitative information they shared. Here’s how we did it.
Step 1: Plan the experience
We prepared a structure based on our hypothesis while making room for the nuances of reality. Expectations obscure truth.
Step 2: Gather the data
As mentioned, we conducted interviews and usability tests because that method worked best for the project. I also prefer to include observational methods when possible, because they can provide insights that might be so much a part of the participant’s mental model that they stop noticing them or think to mention them. According to the Nielsen Norman Group, the general rule of thumb is 5 participants. However, when we interview a larger group, demographic nuances can arise as visible patterns.
Step 3: Record the data
A Google Sheet with questions/topics on the x-axis and the participant’s names on the y-axis worked well for us, especially with usability testing, which has clearly defined topics. In past interviews, we used Google Docs to record more organic, flowing conversations and brought them into Google Sheets later. We video-record whenever possible because human error is inevitable (and part of what makes us amazing, more on that later).
Step 4: Transfer data to digital whiteboard
This part is laborious but trust and believe that afterward, we had a thorough understanding of these interviews. We created another grid with the questions/topics on the x-axis and the participant’s name on the y-axis, much like the Google Sheet, but we broke down each data point into a single post-it and tagged it with the participant’s name. We added context as needed to ensure that the post-it would still be understandable if it stood alone.
Step 5: Bring all data together
We made a copy of what we’d just accomplished in Miro, created a second section, and prepared the post-its for grouping. This is a fast step and easy to ignore, but cognitively, as a matter of recognizing patterns, it’s important.
Step 6: Make content groups
Keeping all the post-its in association with their original questions/topics, we made groups and titled them accordingly. We already began to see patterns. For example, “4/7 people could not accomplish the task at point x,” or “we’ve already titled content groups ‘tried to filter results’ 7 or 8 times!”
Step 7: Move content groups into themes
We removed the content groups from association with questions/topics and grouped them according to the common title patterns we saw. We continued to group according to what made sense and where patterns cropped up. When groups were too large, we created subgroups. This is not work we rushed through. This is work we thought through.
Themes level 2. Themes on themes on themes.
Step 7: Write declarative conclusions based on the patterns
Because we were able to clearly see patterns at this point, we were able to confidently write declarative statements that we could back up. We gave ourselves time and space to think and make connections. We color-coded insights for pain points and delights.
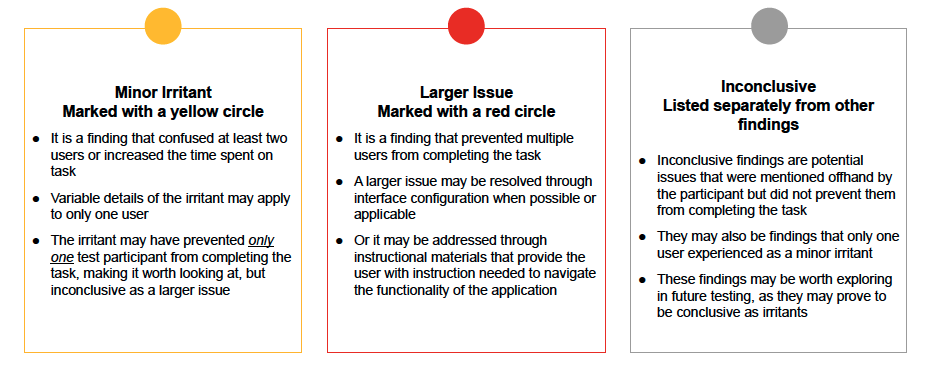
Step 8: Determine severity
Insights must lead to action and therefore must be triaged. We color-coded our pain points according to their severity using the below rubric.


